RPSPASS Outputs
Upon completion of the RPSPASS automated analysis a folder will be created within the directory containing the raw .h5 files. By default the ouput will contain:
- File Export folder
- QC Plots folder
- Cohort Comparison plot (if cohort analysis is turned on)
- RPSPASS Report spreadsheet
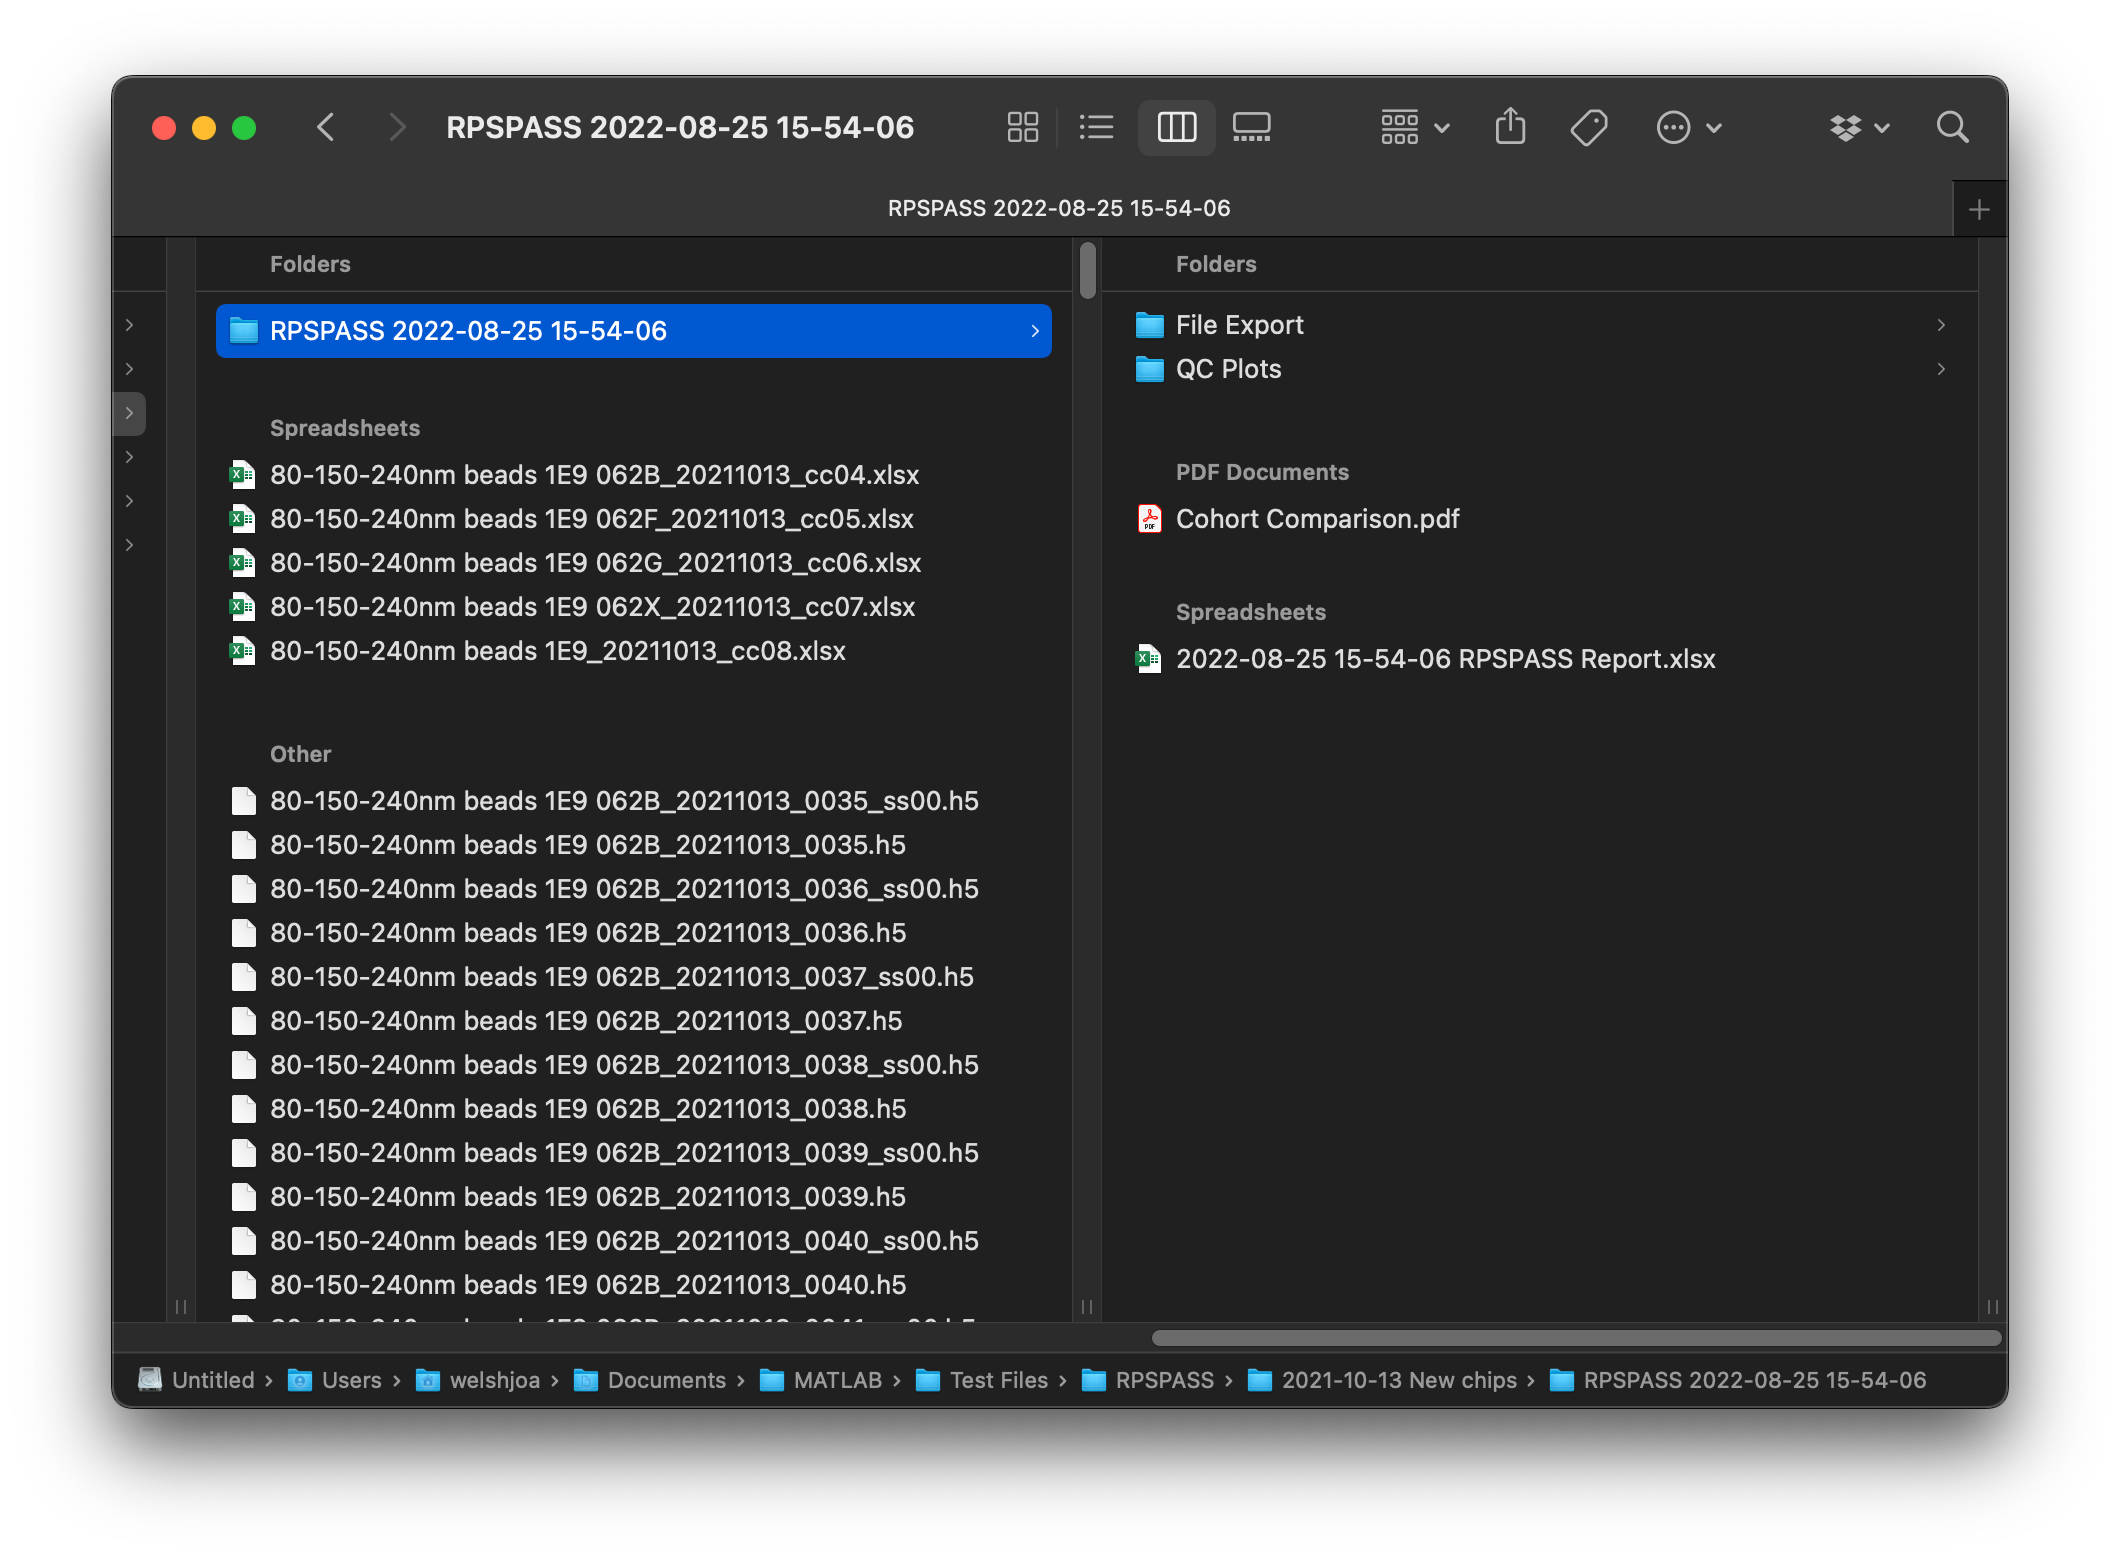
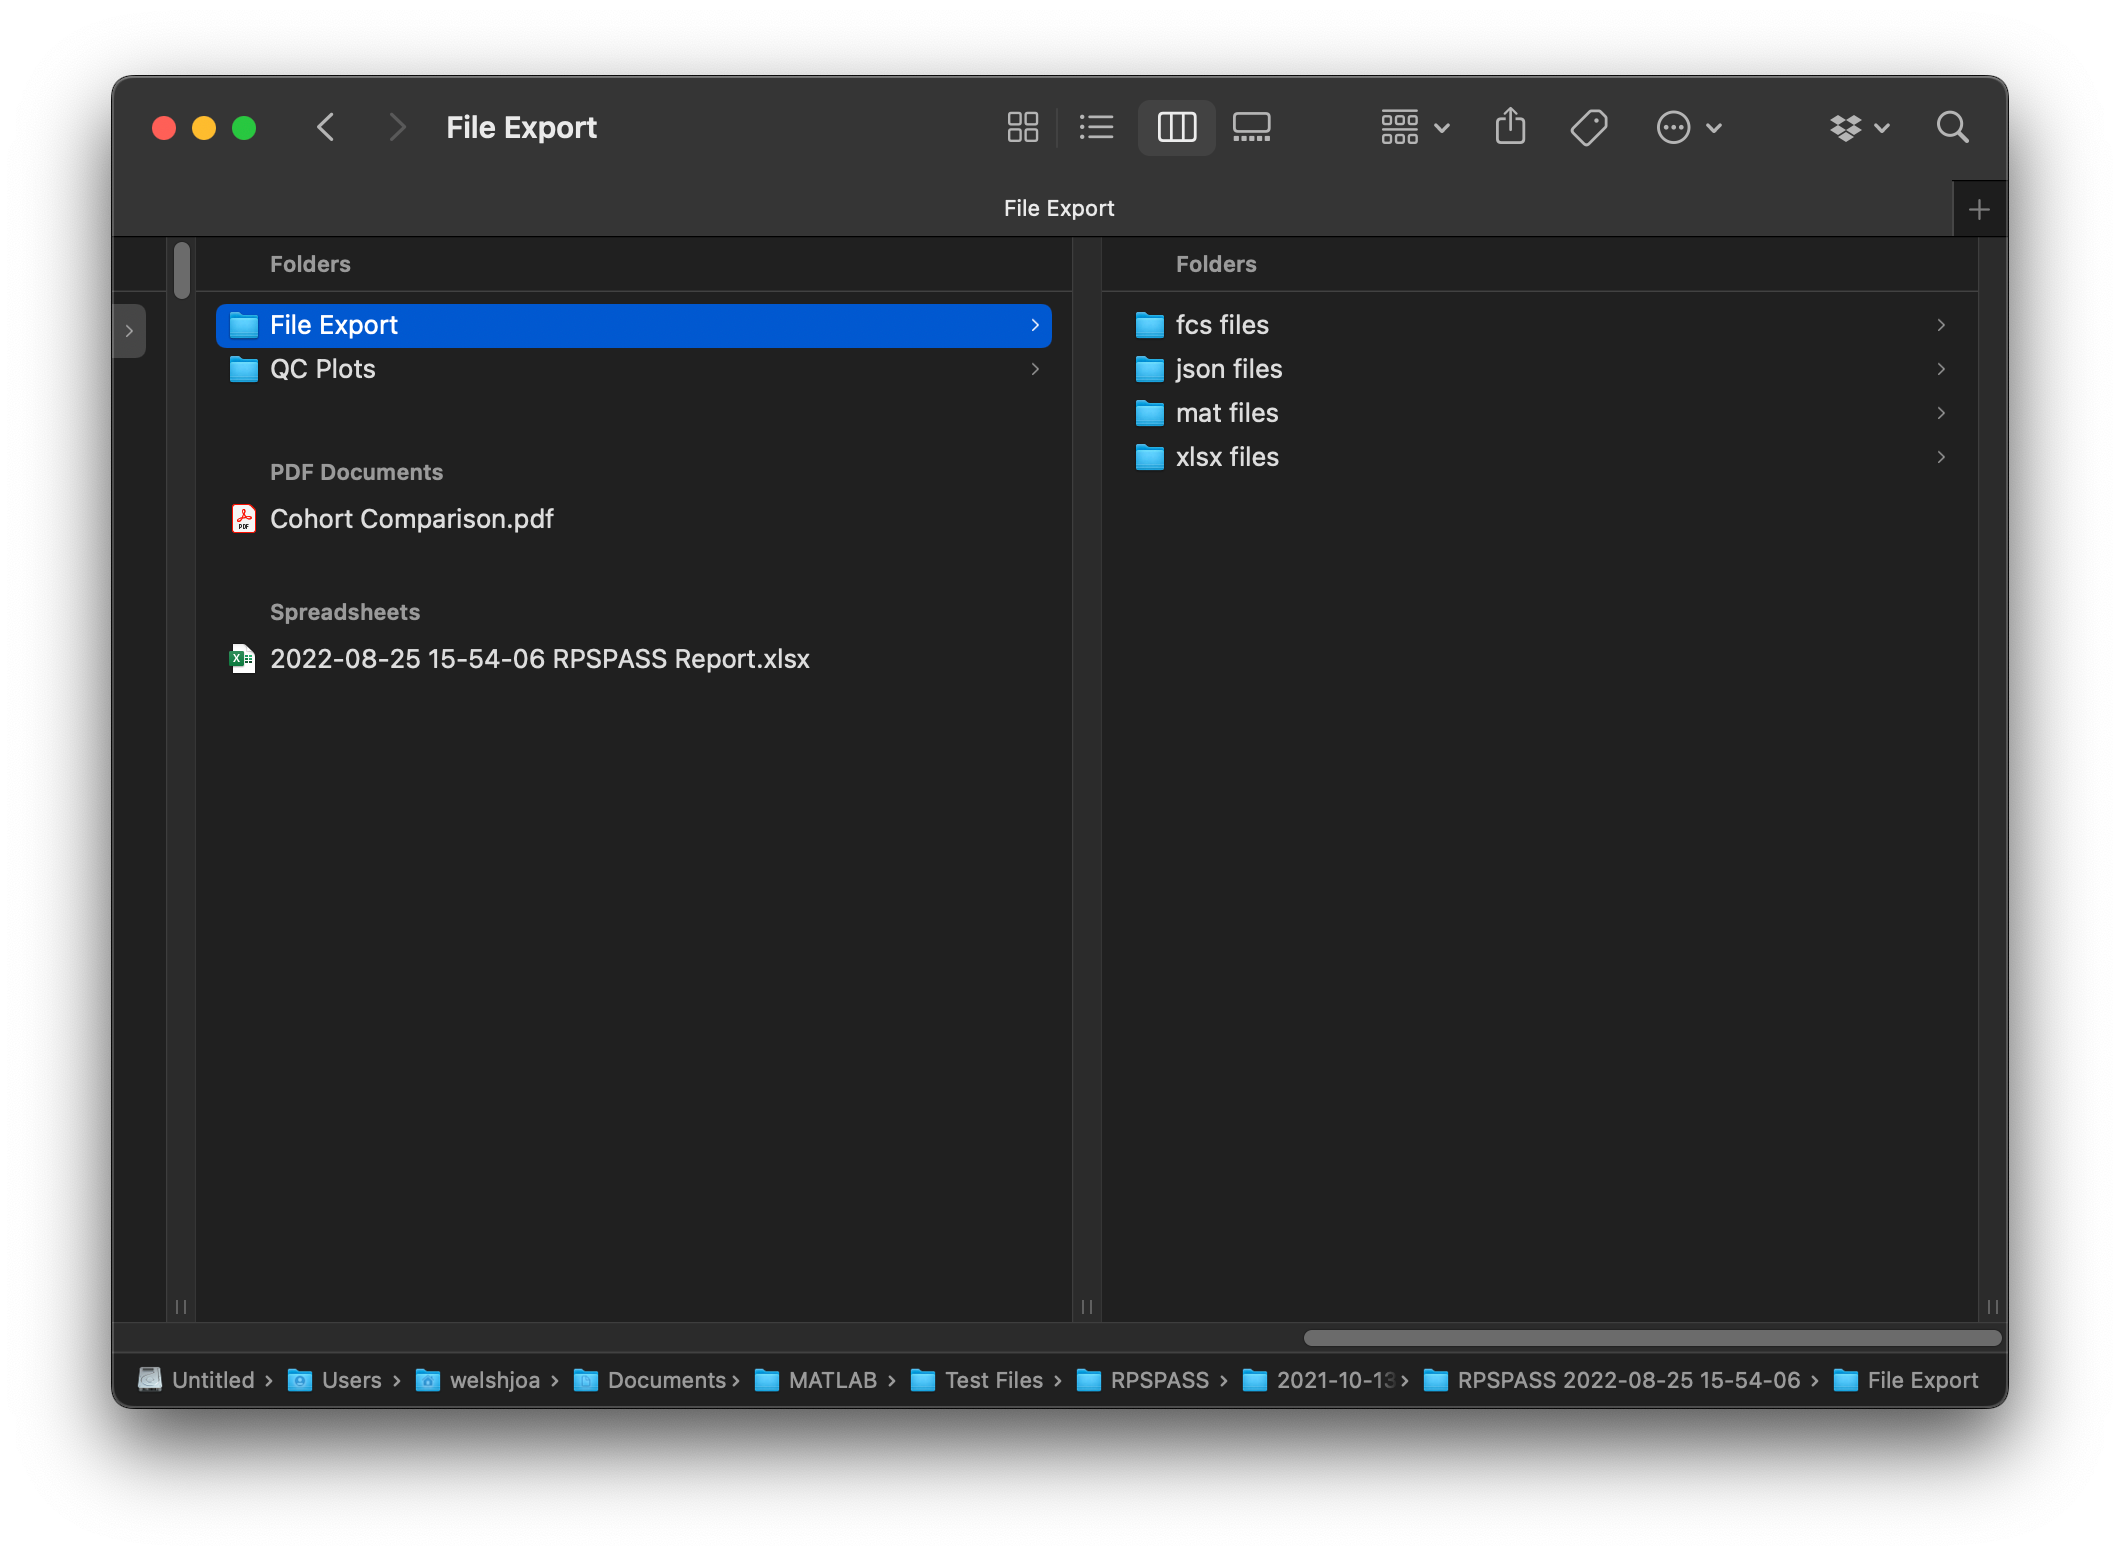
File Exports
File exports are grouped by the file types that have been exported and currently can include .fcs, .json, .mat, and .xlsx file formats.
Note: file outputs can be customized in the preference panel. It is recommended that file formats not being utilized are turned off by default as their creation can result in long processing times for large datasets.
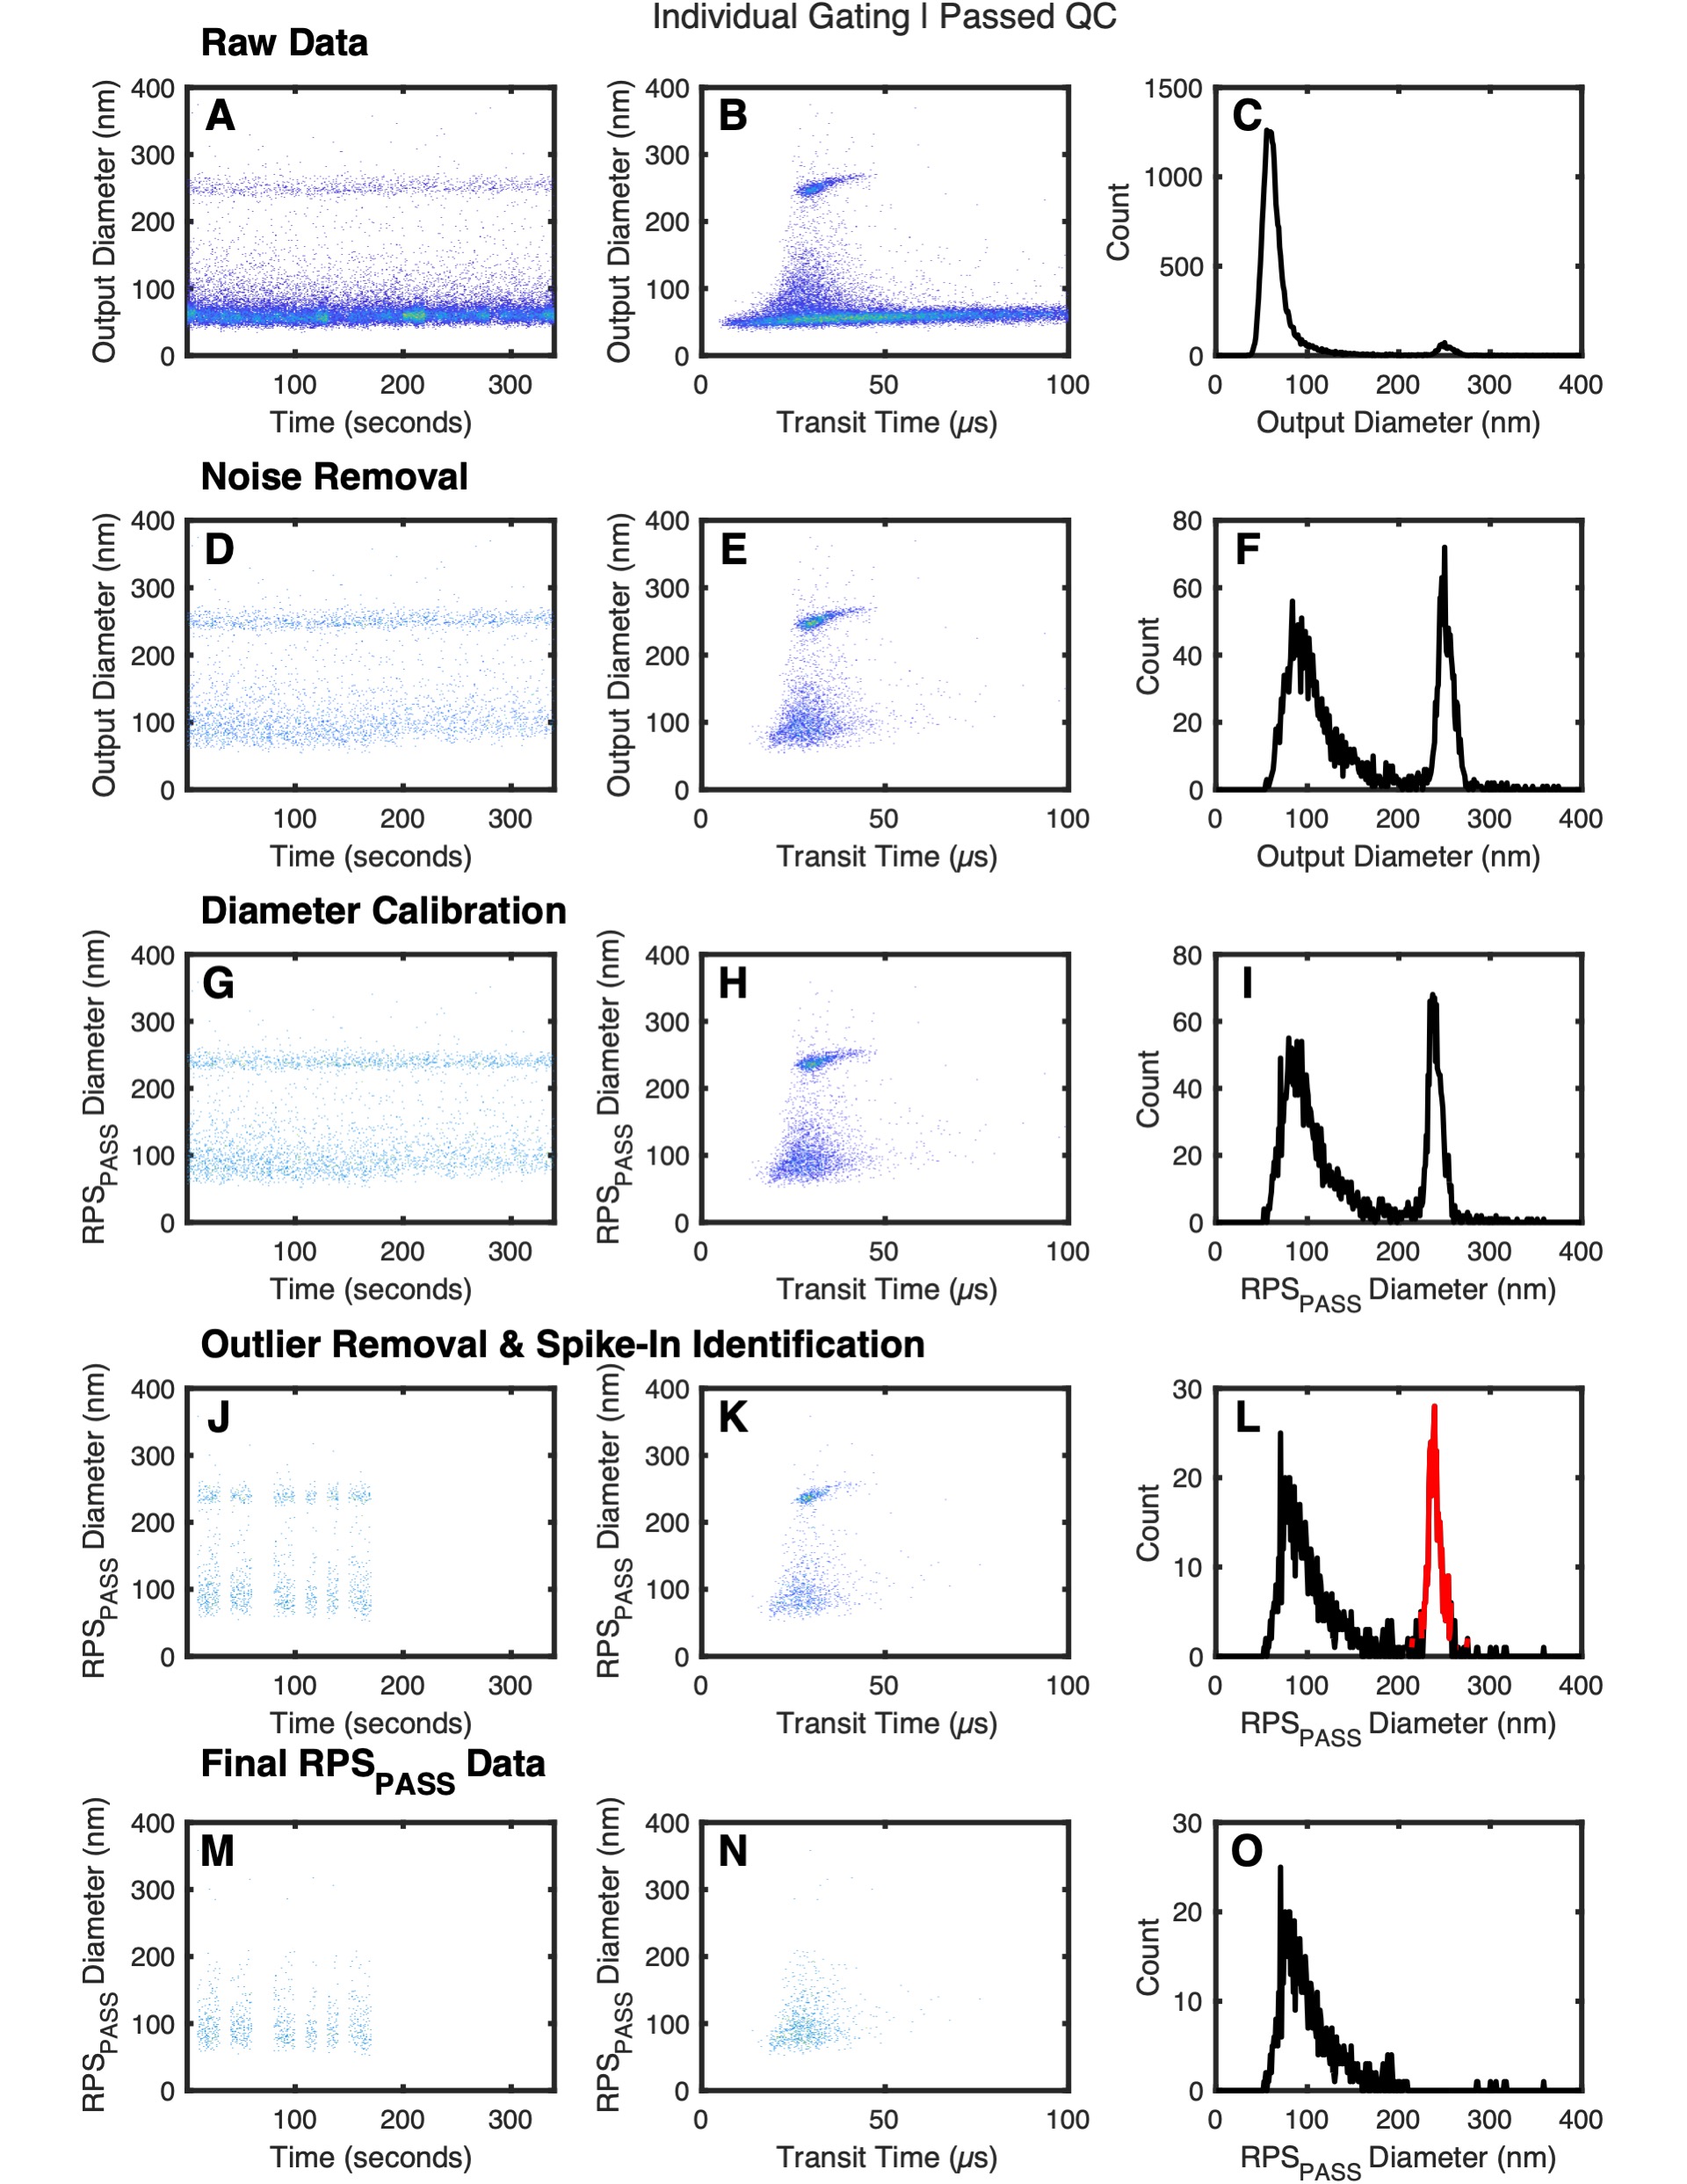
QC plots
By default there each samples .pdf will contain 2 pages. The first page will be an individual analysis QC report and the second page will contain a cohort analysis QC report. The format of these QC reports are as follows:
- Raw nCS1 data plotted using time versus diameter.
- Raw nCS1 data plotted using transit versus diameter.
- Histogram of raw nCS1 data.
- Raw nCS1 data plotted using time versus diameter with noise events removed.
- Raw nCS1 data plotted using transit versus diameter with noise events removed.
- Histogram of raw nCS1 data with noise events removed.
- Dynamically calibrated RPSPASS data plotted using time versus diameter.
- Dynamically calibrated RPSPASS data plotted using transit versus diameter.
- Histogram of dynamically calibrated RPSPASS data.
- Dynamically calibrated RPSPASS data plotted using time versus diameter with outliers removed.
- Dynamically calibrated RPSPASS data plotted using transit versus diameter with outliers removed.
- Histogram of dynamically calibrated RPSPASS data with outliers removed and spike-in beads identified (red).
- Dynamically calibrated RPSPASS data plotted using time versus diameter with outliers and spike-in beads removed.
- Dynamically calibrated RPSPASS data plotted using transit versus diameter with outliers and spike-in beads.
- Histogram of dynamically calibrated RPSPASS data with outliers and spike-in beads removed.
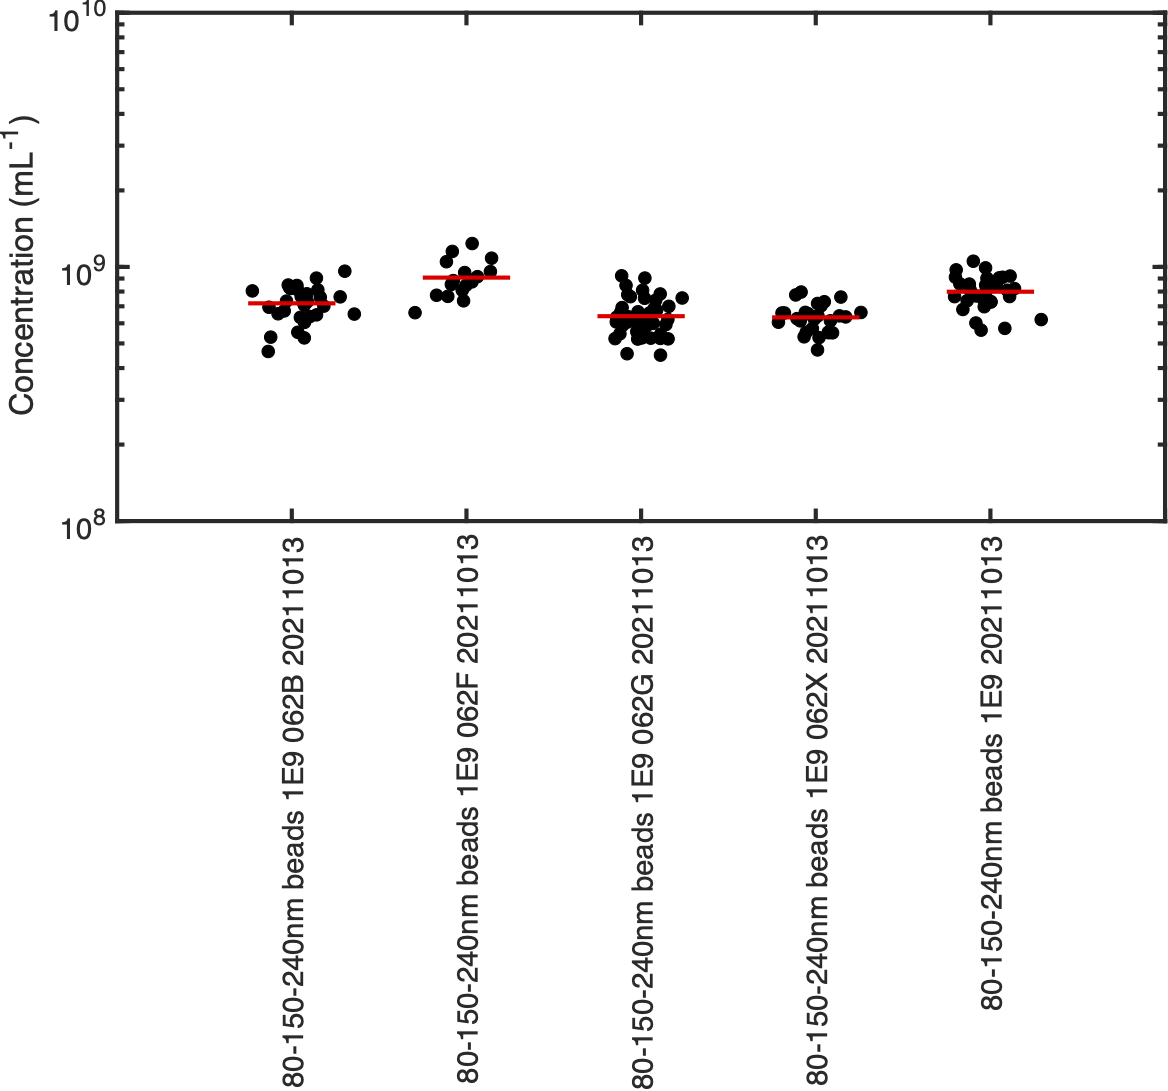
Cohort Comparison
The cohort comparison plot provides an overview of recorded concentration per acquisition. The recorded concentration per acquisition is shown to allow users to view how consistent recordings are. Samples are labelled by their name within the nCS1 acqusition software.
RPSPASS Report
The RPSPASS report consists of 5 sheets:
- RPSPASS Settings - This sheet contains all the software settings used to process the files to enable transparency and reproducibility in reporting.
- RPSPASS Summary - This sheet gives a summary overview of key steps within the analysis pipeline, giving pass/fail information.
- Analysis Metadata - This sheet provides space to report minimal reporting information about the sample analysis to increase the transparency and reproducibility of reporting.
- Stats - Sample Gates - This sheet contains reporting statistics for individual gating of samples.
- Stats - Cohort Gates - This sheet contains reporting statistics for cohort gating of samples and should be used to make sample-to-sample comparisons.
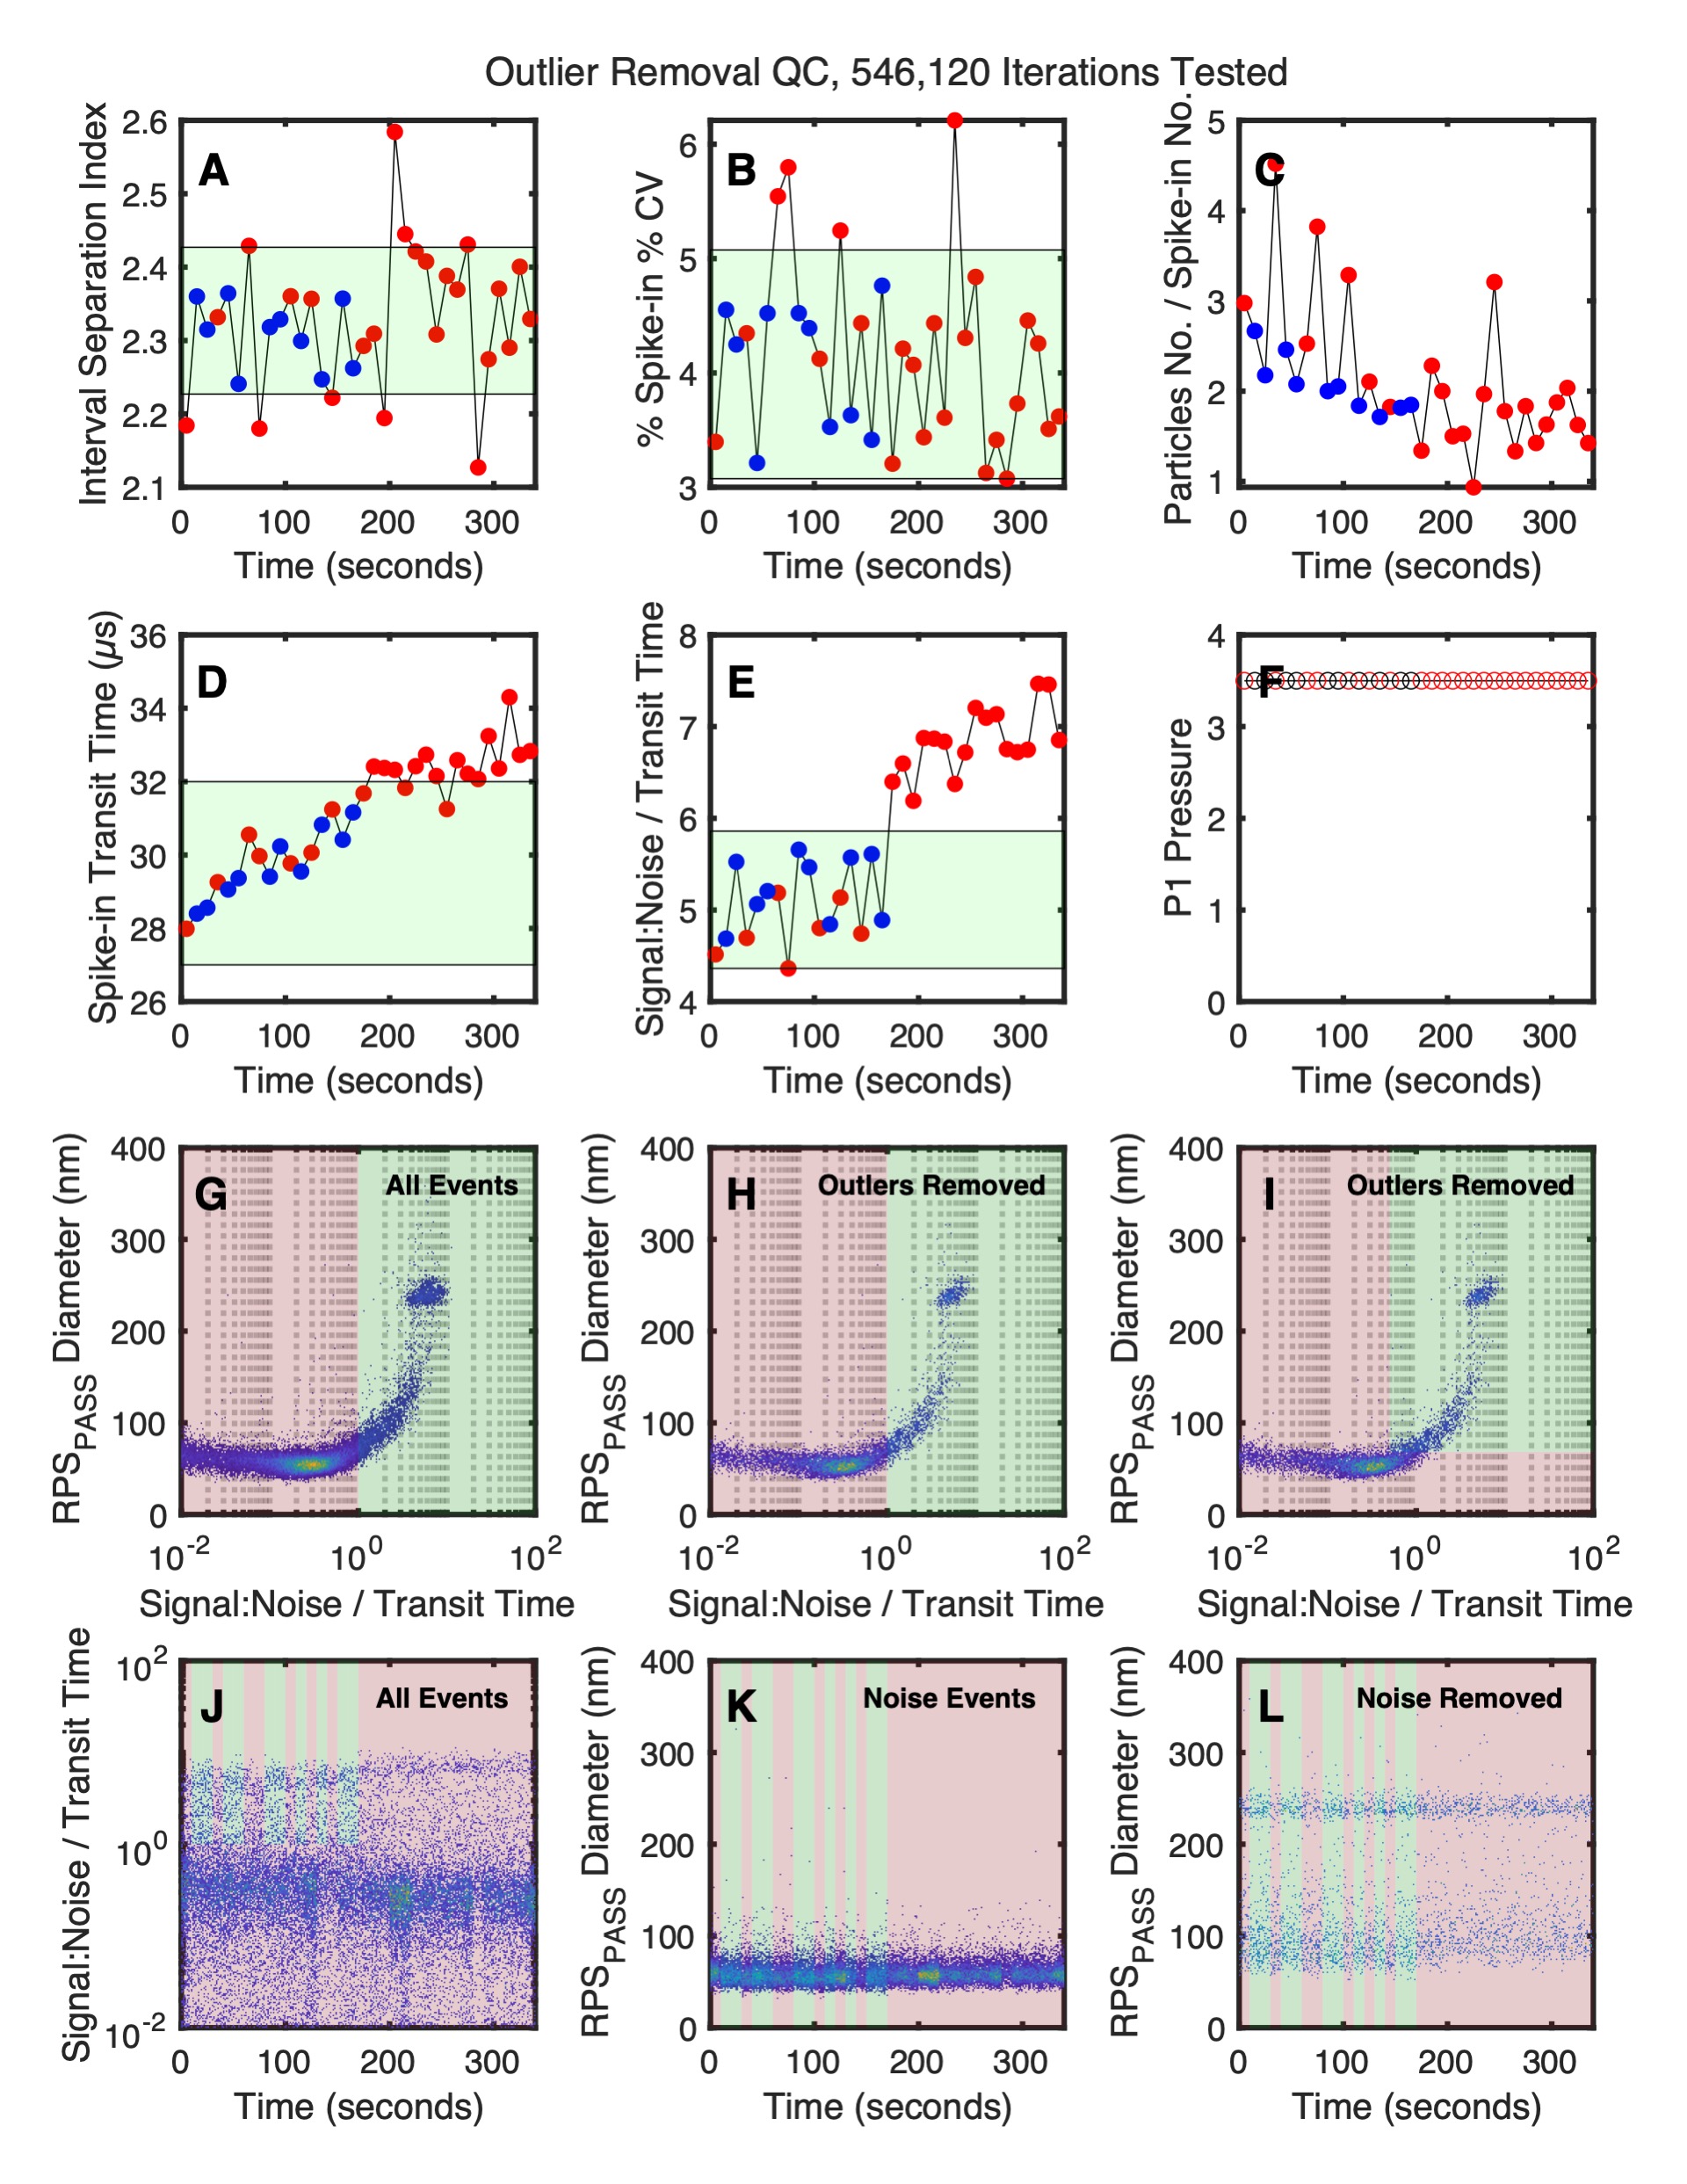
Debug plots
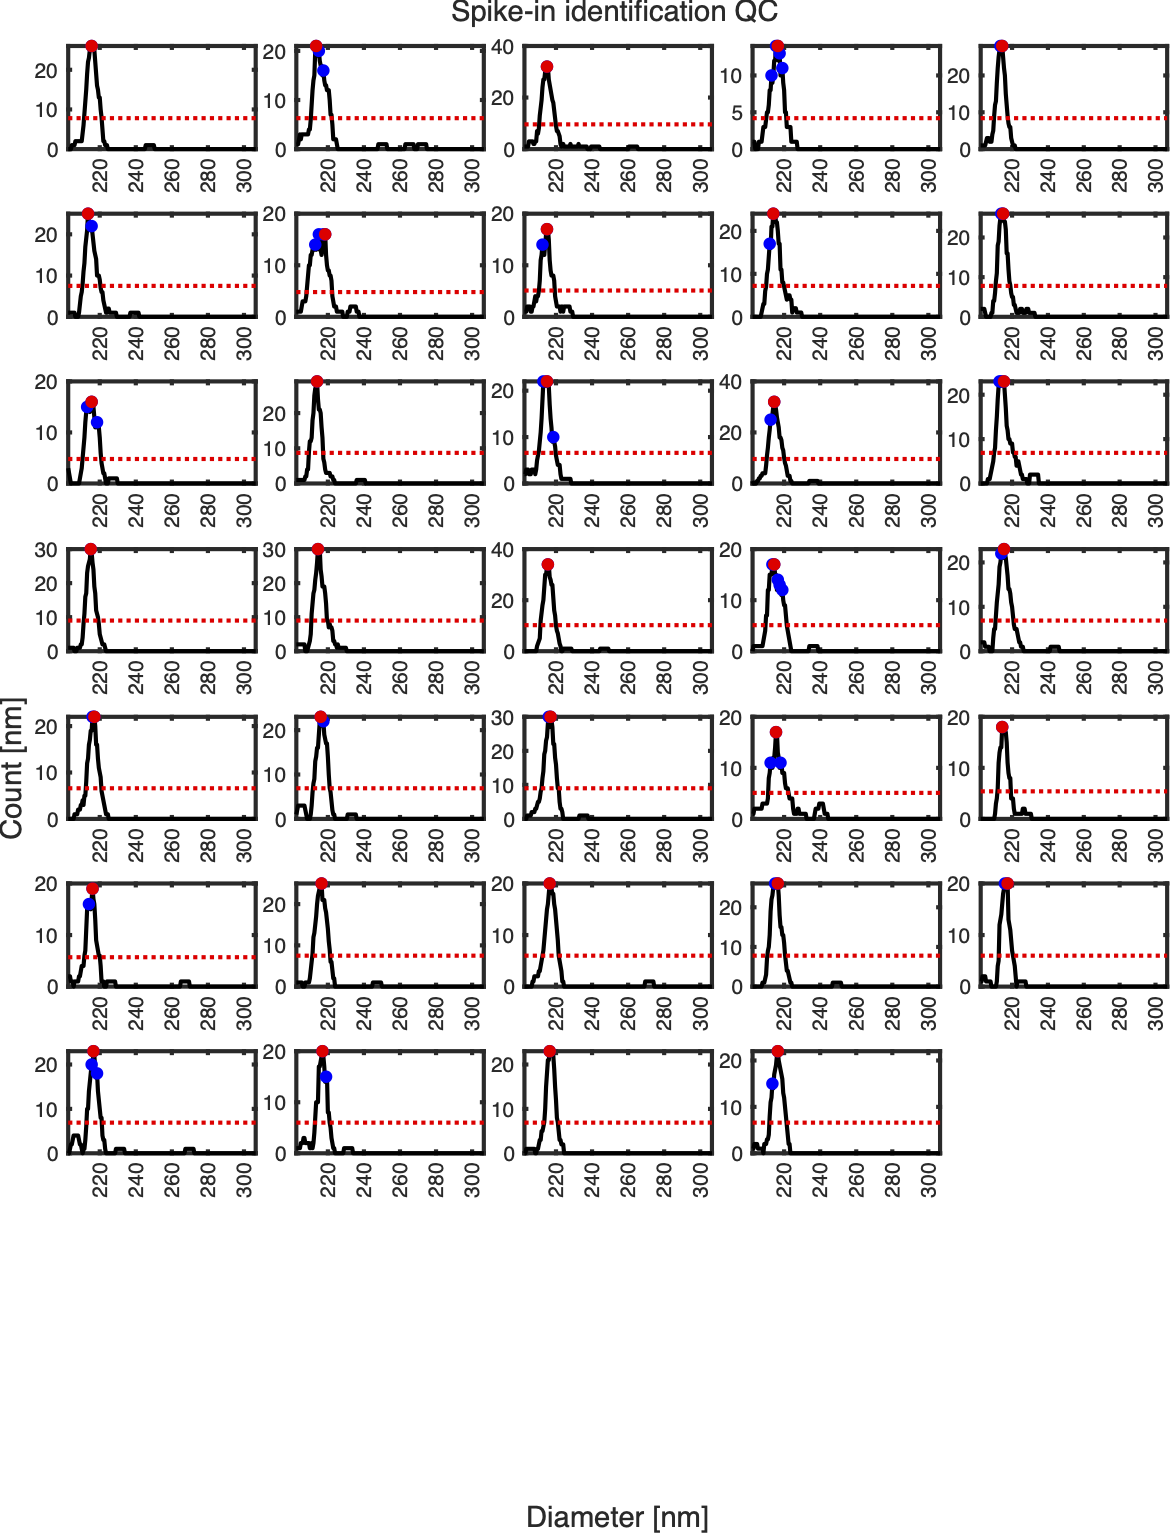
When debug mode is turned on within the preference panel two further plots will appear within sample QC plots.
Spike-in QC plot shows the population considered for each acquisition as a spike-in bead. All peaks within the sample are labelled with a dot. The red dot indicates the peak of the spike-in bead and blue dots indicate other considered peaks.
Outlier remval QC plot shows the hows software calculate the region of most consistency within the file to arrive at the individual and cohort gates.
- Summary statistics for each 5 second acquisition are shown vs separation index.
- Summary statistics for each 5 second acquisition are shown vs spike-in %CV.
- Summary statistics for each 5 second acquisition are shown vs particle number / spike-in number.
- Summary statistics for each 5 second acquisition are shown vs spike-in transit time.
- Summary statistics for each 5 second acquisition are shown vs signal-to-noise / transit time.
- Summary statistics for each 5 second acquisition are shown vs P1 sample pressure.
- The gating of non-background events (green) from background events (red) using the signal-to-noise / transit time parameter with all events.
- The gating of non-background events (green) from background events (red) using the signal-to-noise / transit time parameter after outlier removed event.
- The gating of non-background events (green) from background events (red) using the signal-to-noise / transit time parameter with outlier events removed with a standard gating strategy.
- The resulting identification of outliers (red) from kept acquisitions (green) are shown with all events.
- The resulting identification of outliers (red) from kept acquisitions (green) are shown with noise only events.
- The resulting identification of outliers (red) from kept acquisitions (green) are shown with and non-noise events.